
The Cooperative Program was launched in 1925 as a threefold system of support, allowing (1) a local church to contribute to (2) the ministries of its state Baptist convention and (3) the missions and ministries of the Southern Baptist Convention through a unified plan of giving. This three-legged stool supported a vast array of ministries and propelled Southern Baptists to unprecedented growth, both nationally and internationally, throughout the twentieth century.
When the Great Commission Task Force (GCTF) Report was adopted by messengers to the 2010 SBC annual meeting in Orlando, Florida, it honored and affirmed the Cooperative Program as “the most effective and efficient means of channeling the sacrificial support of our churches through undesignated giving which funds both the state conventions and the work of the Southern Baptist Convention” and called on Southern Baptist churches “to increase the percentage of their Cooperative Program giving.”
The GCTF Report also called upon “state conventions to increase the percentage of Cooperative Program funds directed to the Southern Baptist Convention” and encouraged “every entity of the Southern Baptist Convention to maximize all Cooperative Program funds for the task of taking the Gospel to the nations and serving Great Commission churches in their fulfillment of this mandate.”
The following year, the Convention created Great Commission Giving, a reporting category that aggregates giving to all Southern Baptist-related causes—Cooperative Program as well as “designated gifts given to any Baptist association, state convention, and to the causes of the Southern Baptist Convention.”
Great Commission Giving was created as “a supplement to the Cooperative Program and not as a substitute for Cooperative Program.”

In addition, the GCTF Report called upon Southern Baptists to evaluate their personal budgets in terms of a Great Commission focus and commitment, challenging them to “exercise their stewardship of wealth for the Great Commission” through such things as estate planning and planned gifts to undergird the work of the Great Commission “long after [they] have departed this life.”
This mid-year report provides an opportunity to see the interplay of all three legs of Cooperative Program giving—local churches, state conventions, and the Southern Baptist Convention.
After trending downward since the global economic recession eight years ago, total Cooperative Program from the churches eased upward by almost $1 million in 2015–2016 (see chart below). And, for the first time since the 1950–1951 fiscal year, and only the third time in history, state Baptist conventions have, on average, forwarded more than 40 percent of their Cooperative Program receipts to the missions and ministries of the SBC (see chart below).
Though the two charts to the right—the mid-year national CP financial disbursement report and the mid-year CP income report—do not show a five-year review, they reflect two larger trends. For the fifth year in a row, the International Mission Board has received more than 50 percent of national Cooperative Program gifts; and, for the fifth successive year, designated gifts to SBC entities are on track to surpass national Cooperative Program gifts for Southern Baptist Convention causes.
Prior to the creation of the Great Commission Giving category, Cooperative Program gifts had always outpaced designated giving to SBC causes. Since 2011, designated giving to SBC causes first approached, then surpassed annual CP gifts from the churches.
In 2016, national CP gifts plus direct SBC CP Allocation Budget gifts totaled more than $195.7 million. Designated gifts to SBC causes topped $204.7 million, for a total of $400 million contributed to SBC causes from the Convention’s cooperating churches. Of this, $244 million was given through a combination of CP and designated gifts for international missions through IMB.
Total CP Received by the State Conventions, Forwarded to SBC
| Fiscal Year | Total CP from Churches to the States | CP Forwarded to the SBC | CP Percent to the SBC |
|---|---|---|---|
| 2006–2007 | $532,705,542 | $198,813,698 | 37.32 percent |
| 2007–2008 | $541,898,661 | $198,079,154 | 36.55 percent |
| 2008–2009 | $520,355,537 | $194,310,632 | 37.34 percent |
| 2009–2010 | $495,768,022 | $186,520,660 | 37.62 percent |
| 2010–2011 | $487,884,065 | $186,386,036 | 38.20 percent |
| 2011–2012 | $481,409,006 | $186,640,481 | 38.77 percent |
| 2012–2013 | $482,279,059 | $183,419,803 | 38.03 percent |
| 2013–2014 | $478,700,850 | $180,971,579 | 37.80 percent |
| 2014–2015 | $474,272,984 | $183,771,302 | 38.75 percent |
| 2015–2016 | $475,259,988 | $190,468,781 | 40.08 percent |
Mid-Year Financial Reports, Income, and Disbursements
Southern Baptist Convention Executive Committee
| Cooperative Program Allocation Budget/Designated Receipts Distribution, October 1, 2016 through March 31, 2017 | |||
|---|---|---|---|
| SBC Ministry | CP Allocation Budget | Designated | Total |
| International Mission Board | 49,577,346.89 | 105,579,275.66 | 155,156,622.55 |
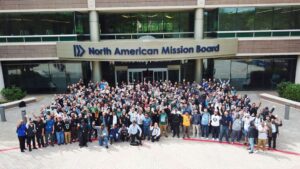
| North American Mission Board | 22,413,563.53 | 9,255,519.77 | 31,669,083.30 |
| Gateway Seminary | 2,116,622.69 | 8,875.43 | 2,125,498.12 |
| Midwestern Seminary | 2,607,919.48 | 8,526.76 | 2,616,446.24 |
| New Orleans Seminary | 3,755,993.65 | 11,739.94 | 3,767,733.59 |
| Southeastern Seminary | 4,104,005.41 | 18,104.51 | 4,122,109.92 |
| Southern Seminary | 4,967,184.46 | 29,484.76 | 4,996,669.22 |
| Southwestern Seminary | 4,006,208.21 | 17,846.08 | 4,024,054.29 |
| Historical Library and Archives | 236,035.76 | 337.14 | 236,372.90 |
| Ethics & Religious Liberty Commission | 1,622,745.93 | 13,613.41 | 1,636,359.34 |
| GuideStone Financial Resources | 0.00 | 10,627.90 | 10,627.90 |
| SBC Operating | 2,940,612.33 | 127,840.68 | 3,068,453.01 |
| Grand Totals | $98,348,238.34 | $115,081,792.04 | $213,430,030.38 |
| Cooperative Program Allocation Budget and Designated Contributions Received from State Baptist Conventions and Other Sources October 1, 2016 through March 31, 2017 | ||
|---|---|---|
| Contribution Source | Cooperative Program Allocation Budget | Designated Gifts |
| Alabama | 8,760,821.11 | 10,752,282.12 |
| Alaska | 109,963.29 | 131,385.53 |
| Arizona | 455,760.15 | 743,983.49 |
| Arkansas | 4,647,310.49 | 5,143,356.15 |
| California | 1,075,331.21 | 1,849,119.86 |
| Colorado | 313,644.71 | 447,326.54 |
| Dakota | 46,257.32 | 84,255.89 |
| DC | 1,722.87 | 4,594.79 |
| Florida | 7,345,620.13 | 4,888,409.11 |
| Georgia | 8,577,743.10 | 9,459,417.07 |
| Hawaii Pacific | 283,717.83 | 187,828.43 |
| Illinois | 1,138,746.73 | 1,265,349.86 |
| Indiana | 314,128.32 | 494,653.52 |
| Iowa | 149,227.37 | 86,208.19 |
| Kansas-Nebraska | 356,032.38 | 538,030.95 |
| Kentucky | 4,962,980.02 | 4,847,036.64 |
| Louisiana | 3,754,002.38 | 4,094,721.18 |
| Maryland-Delaware | 799,199.01 | 872,381.83 |
| Michigan | 164,358.14 | 179,405.73 |
| Minnesota-Wisconsin | 53,177.62 | 103,176.85 |
| Mississippi | 6,002,464.52 | 7,729,438.58 |
| Missouri | 2,994,514.27 | 3,661,194.62 |
| Montana | 74,516.25 | 137,100.17 |
| Nevada | 284,050.49 | 163,954.90 |
| New England | 74,203.25 | 110,696.43 |
| New Mexico | 355,967.42 | 554,930.74 |
| New York | 126,270.57 | 215,646.30 |
| North Carolina | 5,852,958.60 | 11,547,936.64 |
| Northwest | 390,007.75 | 550,988.26 |
| Ohio | 1,037,856.87 | 744,667.26 |
| Oklahoma | 5,145,971.48 | 4,161,449.55 |
| Pennsylvania-South Jersey | 108,847.70 | 175,889.02 |
| Puerto Rico/Virgin Islands | 1,868.14 | 7,500.00 |
| South Carolina | 5,608,649.45 | 6,976,164.86 |
| Tennessee | 7,680,875.05 | 9,381,829.86 |
| Texas (BGCT) | 5,479,004.56 | 8,398,807.65 |
| Texas (SBTC) | 8,006,258.93 | 7,295,949.31 |
| Utah-Idaho | 89,755.46 | 151,892.43 |
| Virginia (BGAV) | 496,579.31 | 1,880,806.43 |
| Virginia (SBCV) | 2,246,478.38 | 3,426,362.45 |
| West Virginia | 236,652.17 | 256,695.44 |
| Wyoming | 53,807.14 | 68,808.00 |
| Subtotal | $95,657,301.94 | $113,771,632.63 |
| Churches & Individuals | 2,690,936.40 | 1,310,159.41 |
| Grand Total | $98,348,238.34 | $115,081,792.04 |